Maurer Rose
Mathematics can be very beautiful. Below is javascript implementation of mathematical rose - (rhodonea curve is a sinusoid plotted in polar coordinates) with Maurer rose (consists of some lines that connect some points on a rose curve). Formulas is relatively simple, and can be found in wikipedia pages: Mathematical Rose and Maurer rose.
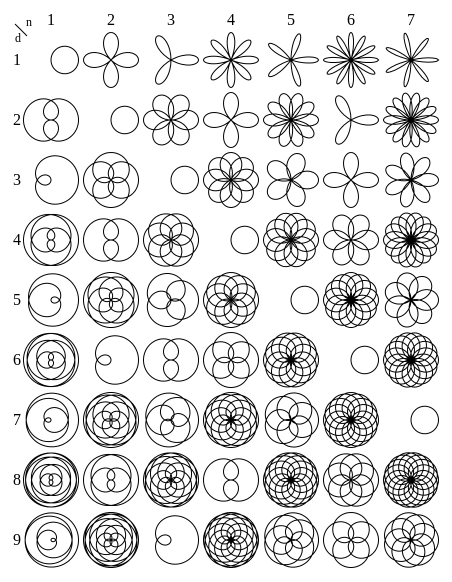
Good place to start for you to experiments with rose is this chart:
Mathematical “rose” or “rhodonea” curves, based on the polar-coordinates equation r=cos(θ*n/d). In this chart, the values of parameter n varies from 1 to 7, while d varies from 1 to 9.
The Rose itself is red and “Maurer” part is blue. A Maurer rose of the rose r = sin(nθ) consists of the 360 lines successively connecting the above 361 points. Thus a Maurer rose is a polygonal curve with vertices on a rose. “maurer” parameter defines an angle between start of walk (first line) and next step (next line). The first line starts at coordinates (0,0) and there the final line ends.
Experiments with rose and her Maurer part can be very interesting.
I suggest for you to try: [n: 0.01, d: 8.16, maurer: 21], [n: 2, d: 1, maurer: 71], [n: 2, d: 5, maurer: 56], [n: 7, d: 1, maurer: 29], [n: 5, d: 2, maurer: 66], and so on
NB! New and all inproved version
Possibilities are infinite, have fun! Source code - on my GitHub
Happy Valentine's!
Select n:
Select d:
Select maurer:
Show rose Show Maurer lines